
Fleet and Site Management
Multi-fleet view to critical assets Health and Emissions is a foundation for enterprise-wide optimization
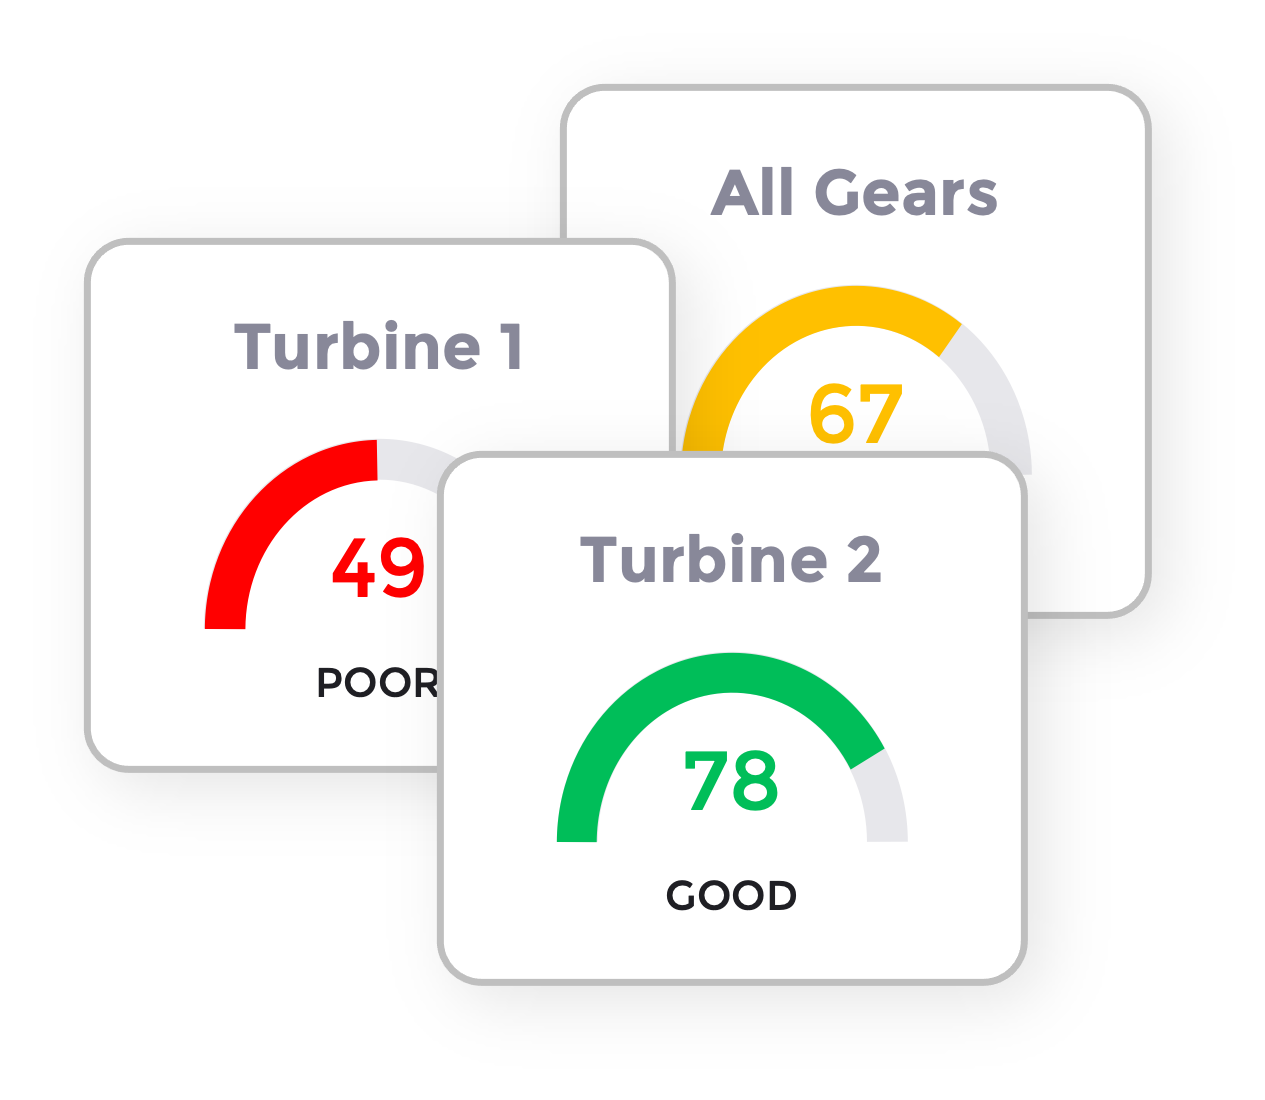
Fleet and Site Management
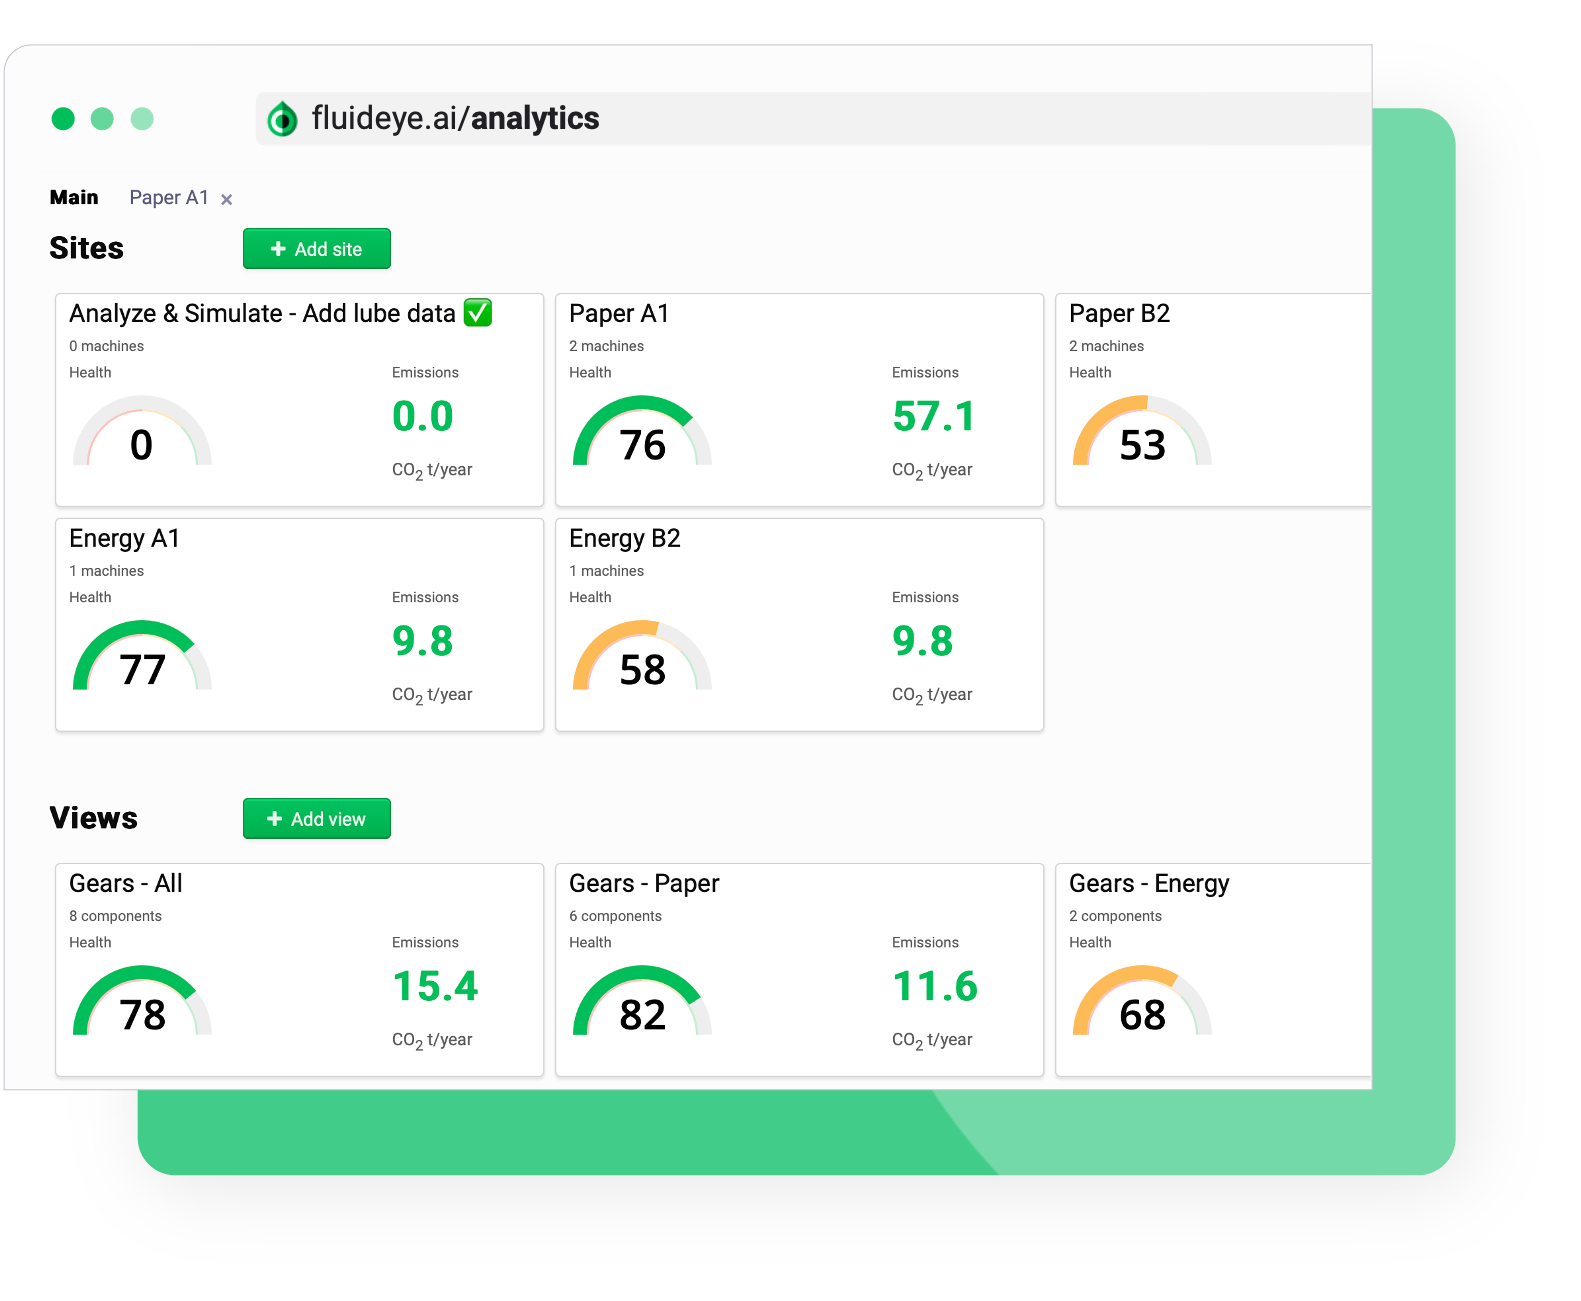
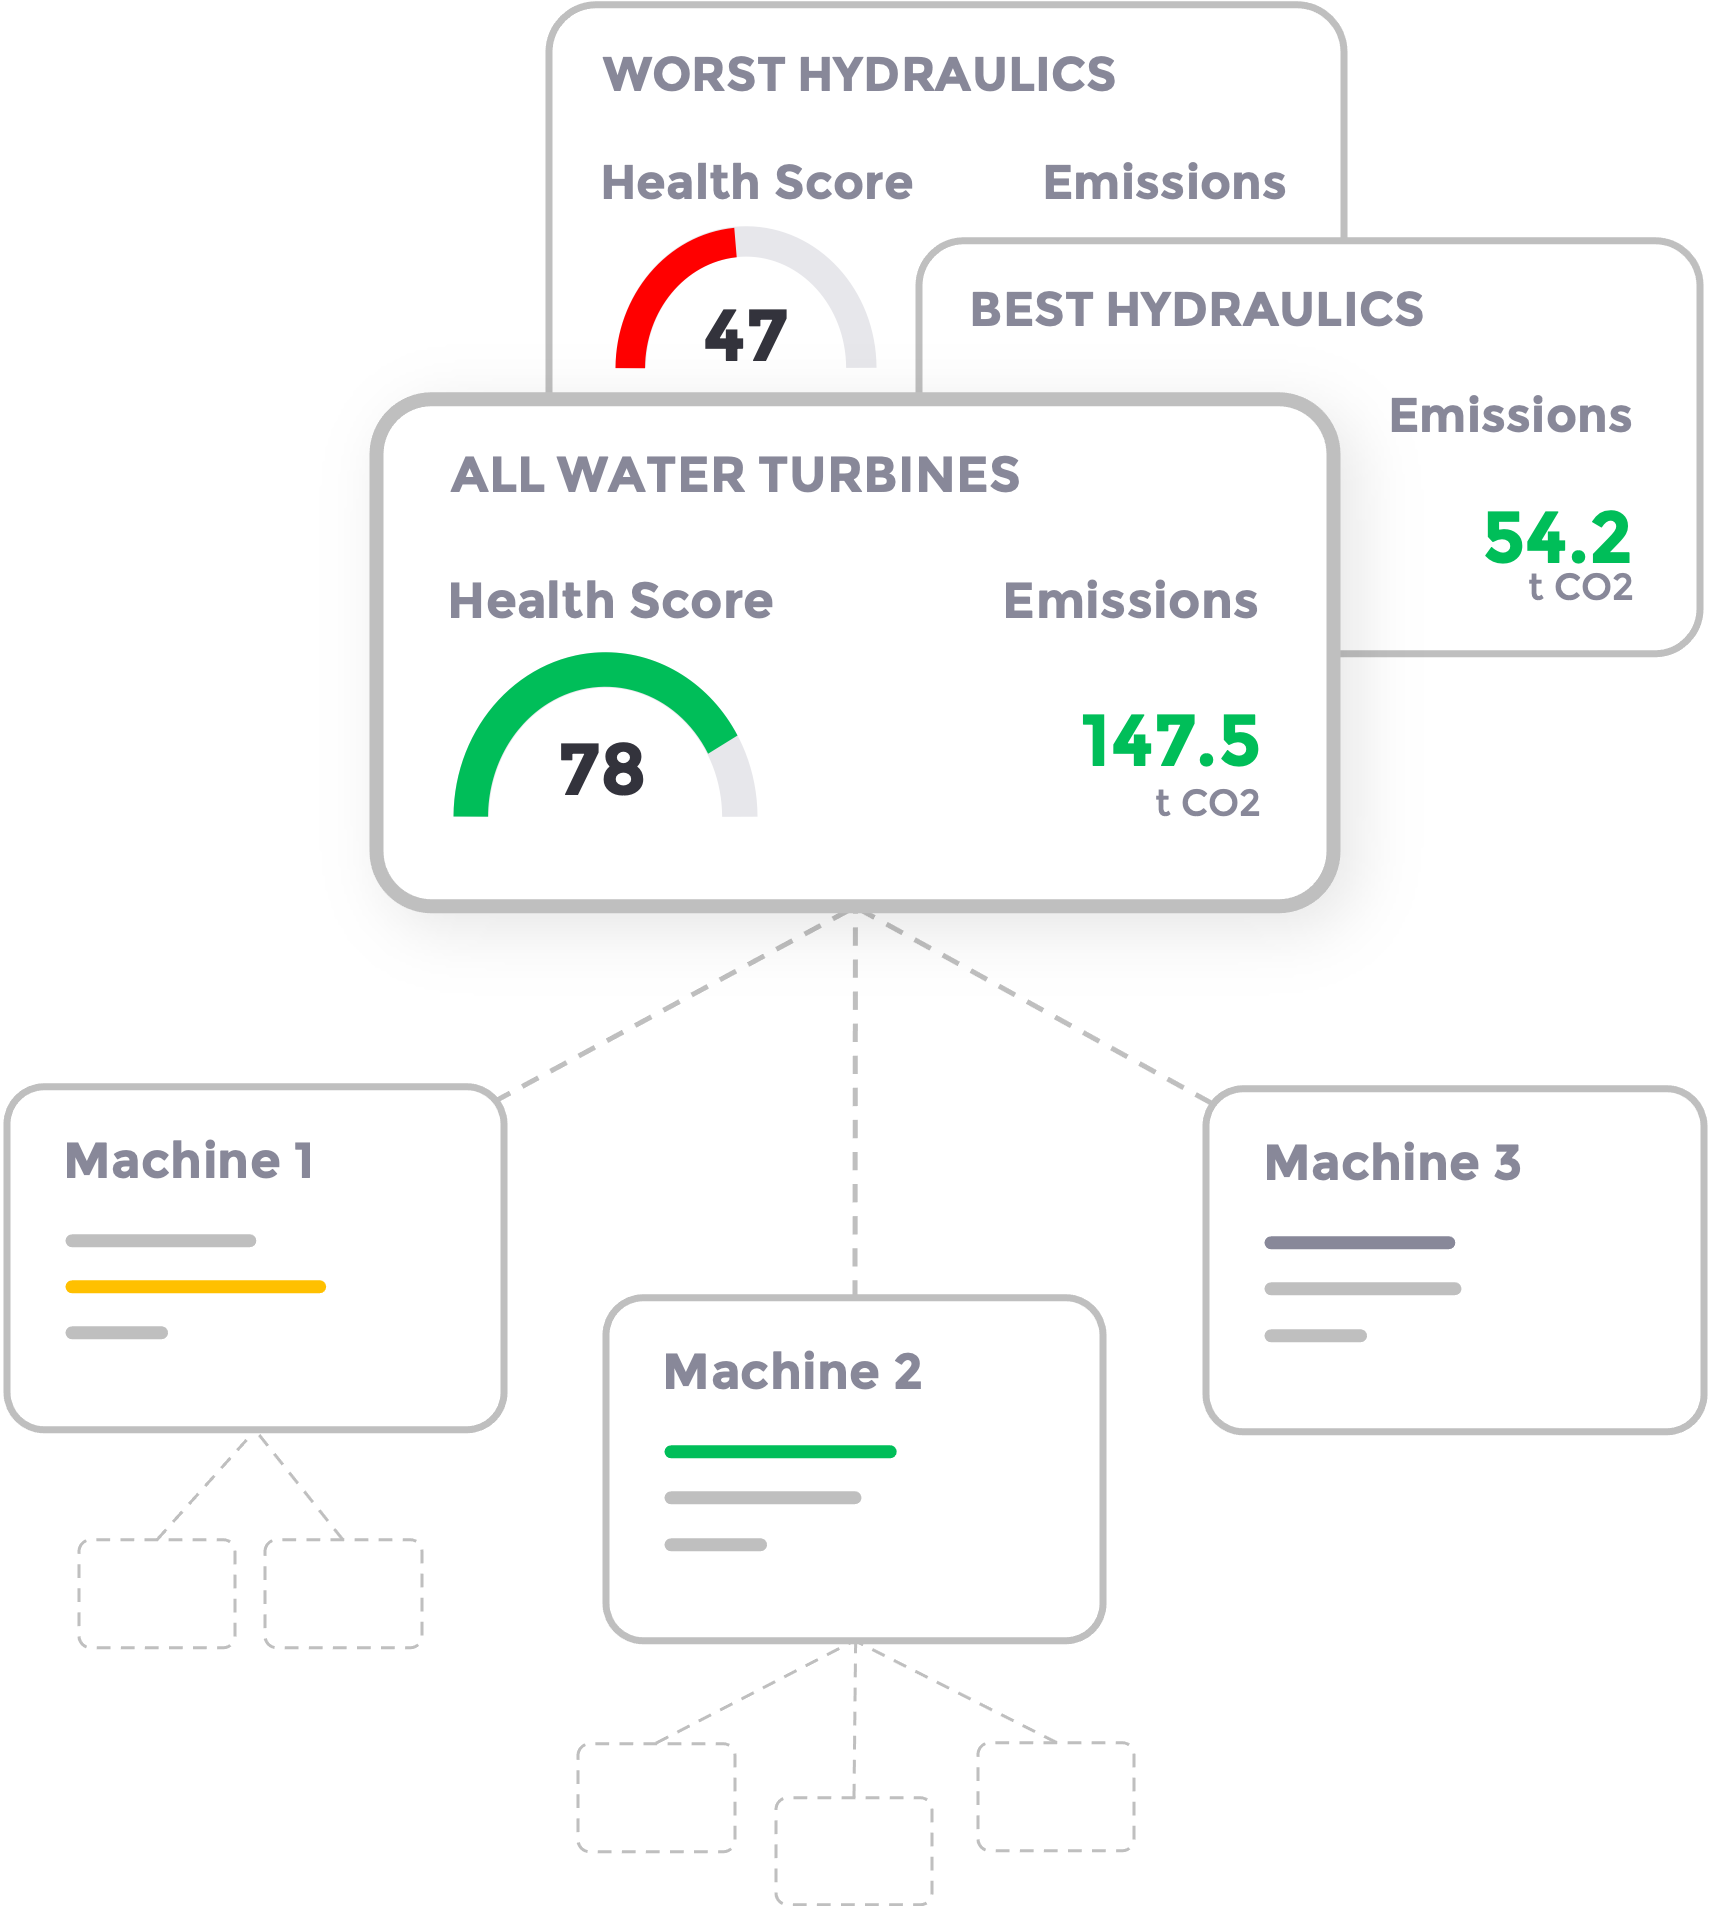
Feet and Site Management lets you to manage all your assets fluid data easily in one view. See fleet and site KPIs, drill down to details with few clicks and get actionable advice for fleet optimization.
Multiple fleets and sites in one view
See performance KPIs for Health and Emissions
Create dynamic fleet views for easy comparison
Analysis and Reporting
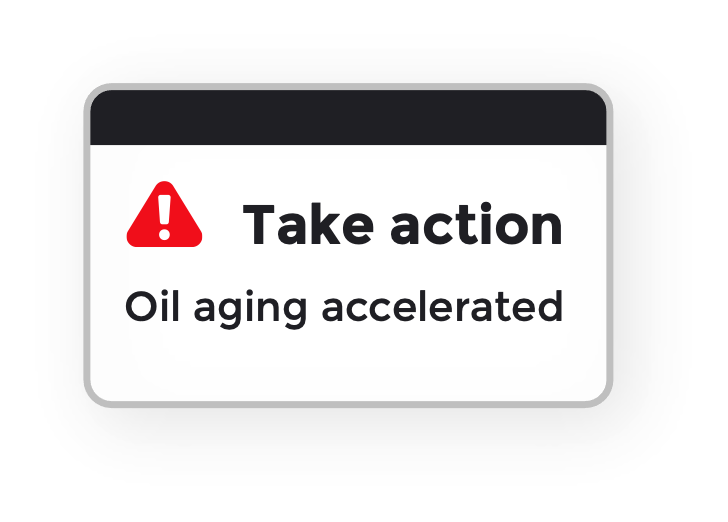
Get up to date visibility to all your fleets and sites performance. While viewing KPIs and development trends Fleet Management alerts also about smallest anomalies so you won’t miss a detail.
Automated fleet performance analysis
See fluid and machine types volatility analysis
Get actionable advice for fleet optimization
Benchmarking
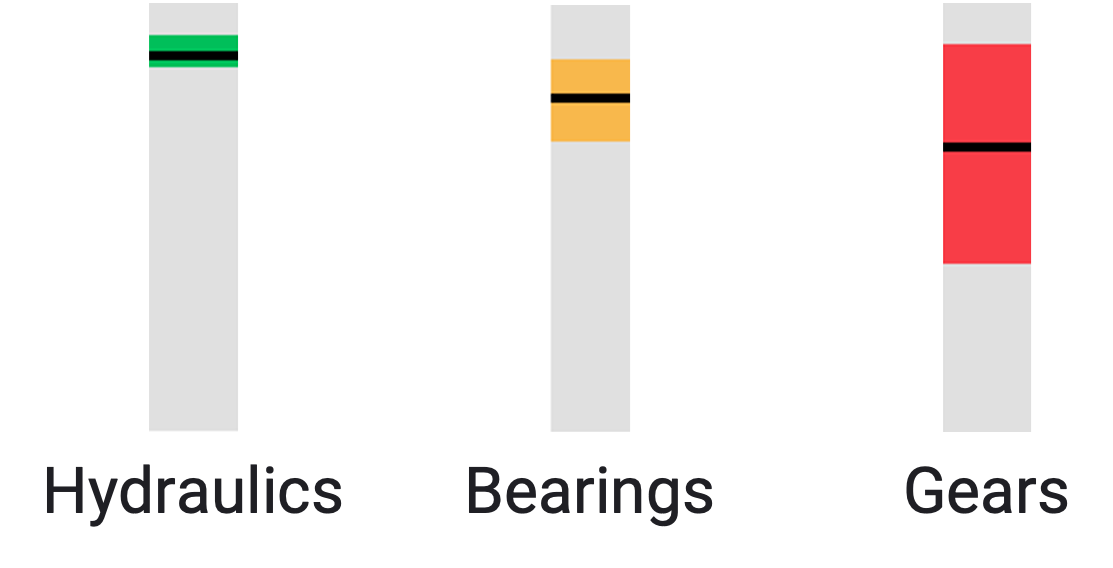
Benchmarking let you to create easily fluid and machine groups for dynamic fleet comparison. The service enables even industry benchmarking to optimize your fleet and site performance.
Create unlimited virtual fleets for dynamic comparison
Benchmark fleets, sites and get even industry benchmarking
Get dynamic reports for your needs
Fleet-Level Condition Management Requires an Integrated Model
Managing multiple assets and sites requires oil analysis, real-time condition monitoring, and lubrication optimization to function as one unified system.
→ Learn how to build integrated condition management at the enterprise level.